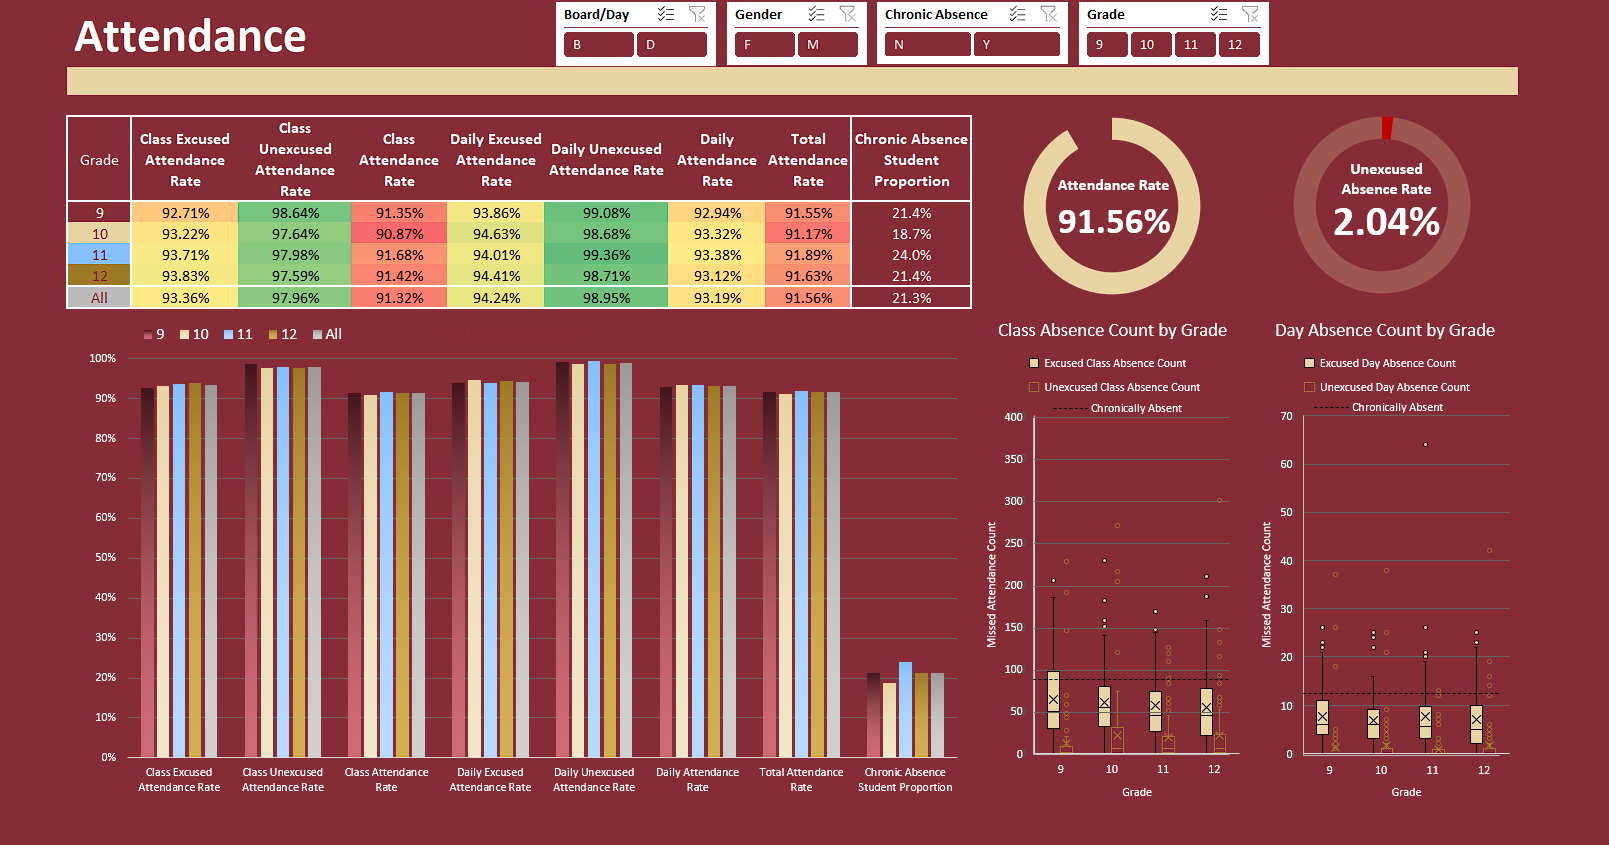
Presented here is a dashboard showcasing school attendance throughout the academic year, featuring informative donut charts that capture the comprehensive view of overall attendance and unexcused absence rates. The attendance breakdown categorizes absences into excused and unexcused, empowering stakeholders to gain valuable insights into students' attendance patterns and their time spent away from school.
To create these impactful dashboards, data was extracted from the school's database using SQL. As the existing database system lacked the capability to generate concise summary statistics and visually appealing visualizations for student data, a pragmatic solution was devised. By transferring the data to a spreadsheet, the foundation was set for crafting these informative dashboards. The subsequent sharing of this spreadsheet through the school's Google Workspace seamlessly enabled teachers to access and review comprehensive attendance details for individual students, fostering a data-driven approach to optimize student engagement and success.
Data has been replaced with fabricated data for privacy reasons.
