Excel dashboards provide a centralized platform for aggregating and presenting complex data, making it easier to analyze trends, monitor key performance indicators, and make data-driven decisions. The interactive features such as slicers, drop-down lists, and dynamic charts enable users to drill down into specifics, offering a more flexible and efficient way to interpret and share information.
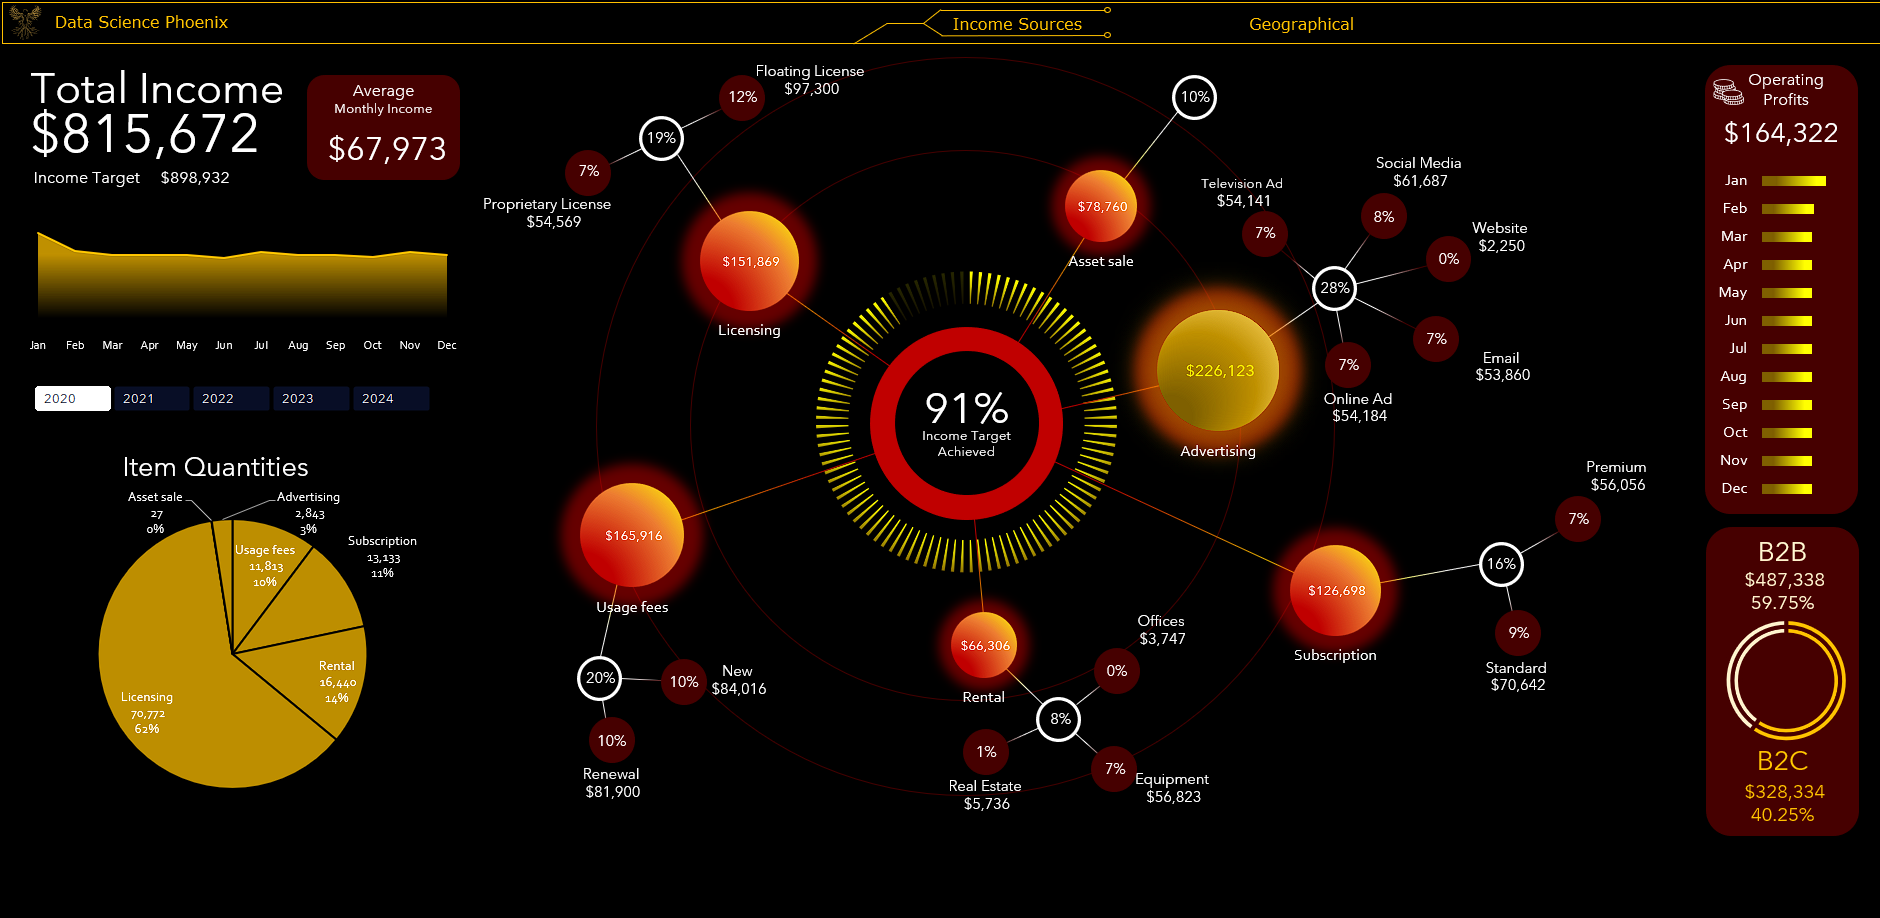
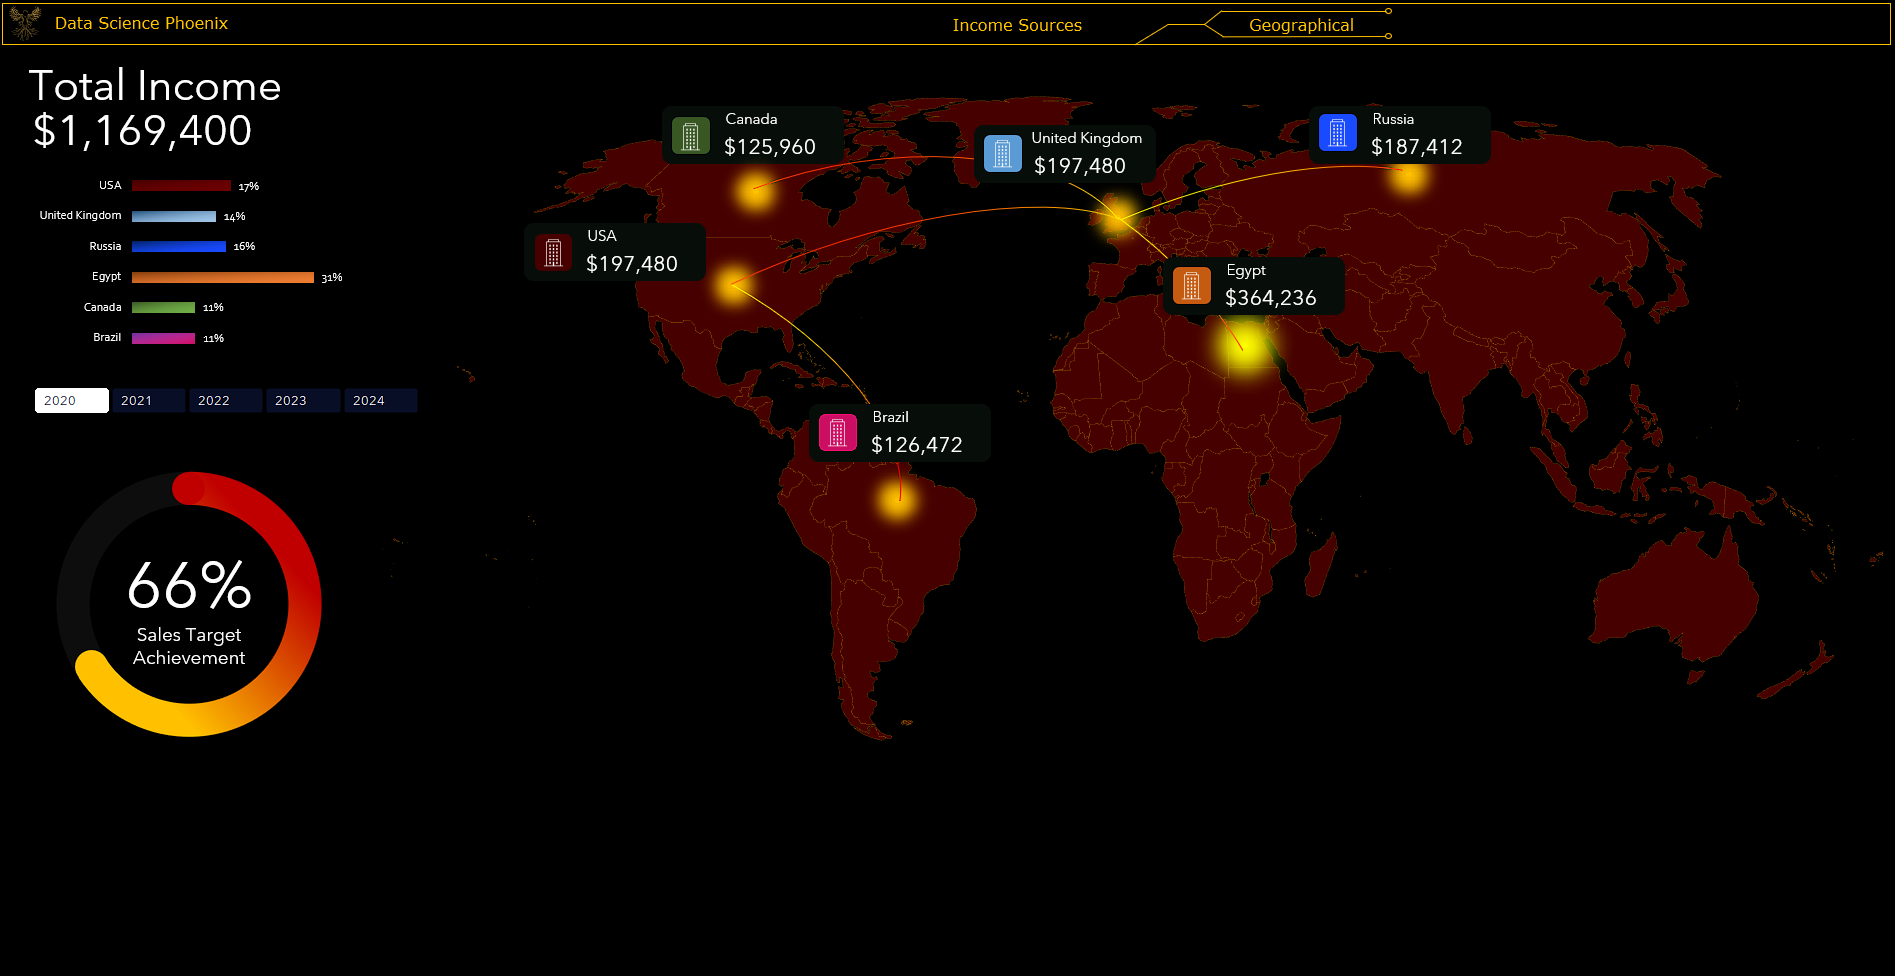
This visually stunning dashboard is used to display company financials. The dashboards highlight the most valuable income sources using a web chart as well as global income indicated geographically on a world map. Slicers are used to provide an interactive year control.
Download the Excel dashboard (Microsoft Excel 2021 or later required)
Finanacial data is fabricated for demonstration purposes.